
 6 mins read

Most organisations know their headcount to the decimal, but far fewer know what it costs when someone walks out. Employee attrition cost almost never appears as a single line in a budget. It is scattered across recruiter fees, manager hours and slow ramp-ups. This report brings together figures from Gallup, SHRM, Aon, Mercer, the Work Institute and regional surveys to show where attrition stands worldwide and what it costs.
Attrition is cooling, but that is only half the story
The headline numbers look calm. Labour-market trackers recorded a steady slide in global hiring and turnover through late 2025, with monthly turnover touching its lowest level since 2020. Mercer put voluntary turnover in the United States at about 13% for 2025, and Korn Ferry placed the global median employee turnover rate at roughly 11.4%.
Low movement, however, is not the same as high loyalty. Gallup's 2025 World Poll found that around half of employees worldwide were watching for, or actively looking for, another job. Many stayed because openings were scarce, not because they were happy.
Gallup's 2026 State of the Global Workplace report adds context. Only 20% of employees were engaged at work in 2025, the lowest reading since 2020, and manager engagement fell from 31% in 2022 to 22%. Gallup estimates that low engagement costs the world economy about $10 trillion in lost productivity, close to 9% of global GDP. Employee engagement is not the same thing as attrition, but it is one of the earliest warning lights: Gallup found that highly engaged teams have 21% lower turnover in high-turnover organisations and 51% lower in low-turnover ones.
Attrition rates around the world
Numbers vary by country, sector and by how each survey defines a leaver, so any single global figure should be read with care. A few reference points:
- India: Aon's survey series showed overall attrition easing from 18.7% in 2023 to roughly 16–17% in 2025, though published figures differ slightly between editions. IT, banking and e-commerce run well above the national average.
- China: 51job reported a turnover rate of 14.8% in 2025, the third straight annual decline from 16.6% in 2023.
- Southeast Asia: Aon's data put overall turnover at 19.3% in Singapore and 20% in the Philippines.
One pattern repeats everywhere: the first year is the riskiest. The Work Institute's Q1 2026 data showed that employees with less than a year of service made up 28.4% of all separations.
The cost of replacing an employee
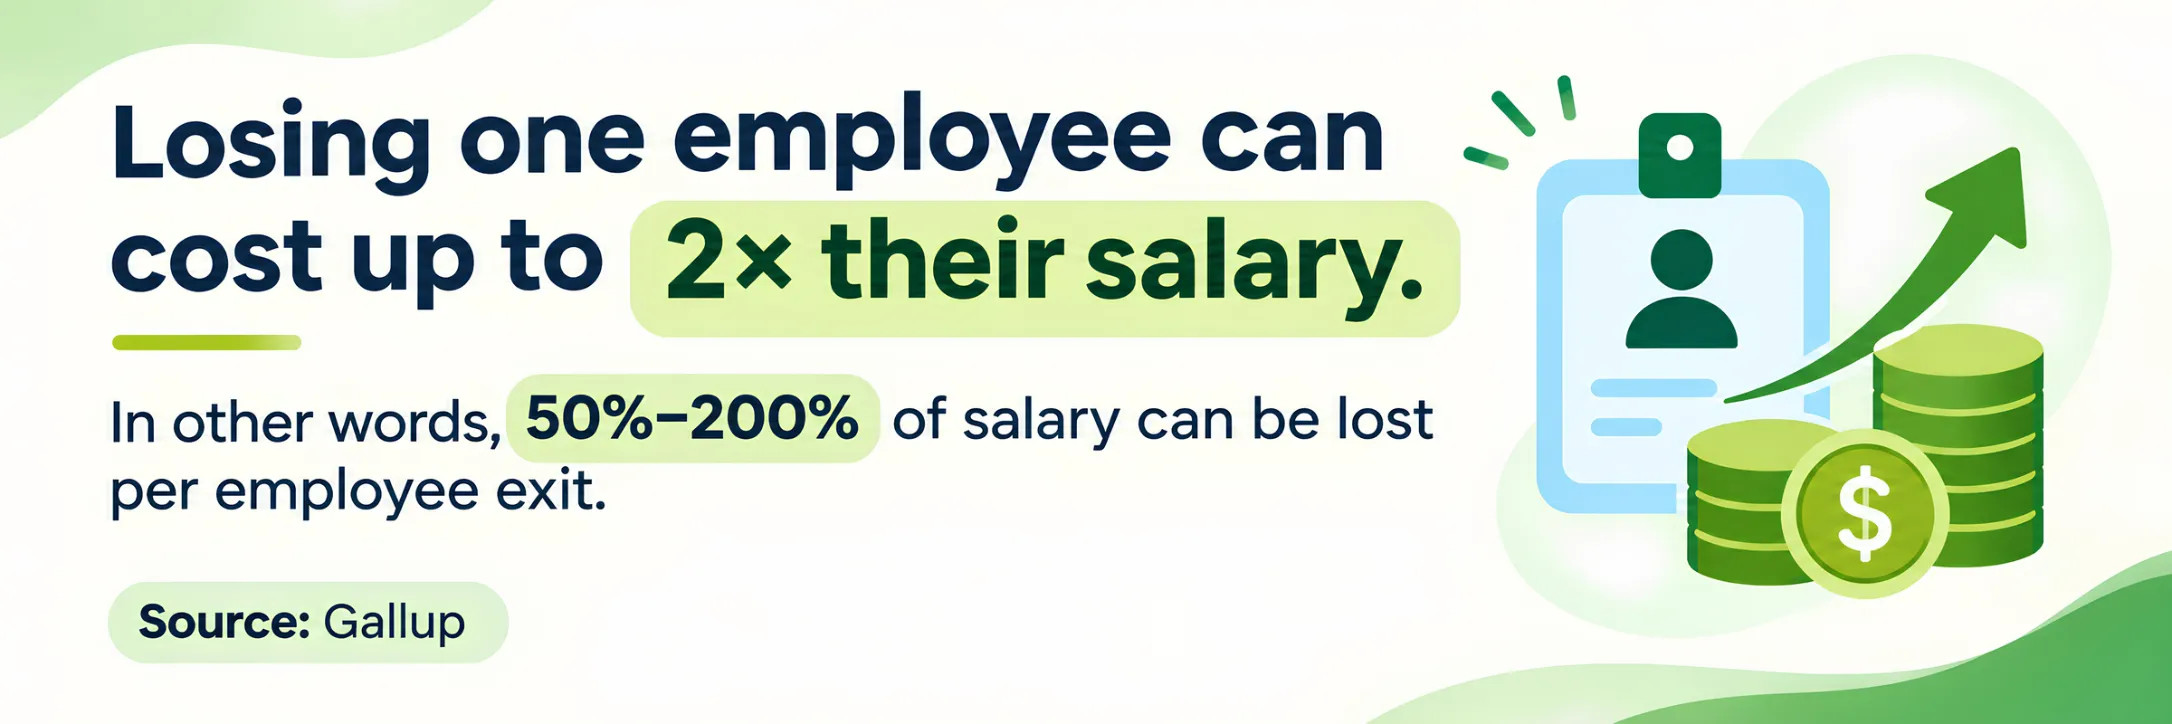
The most quoted benchmark comes from Gallup, which estimates that the cost of replacing an employee ranges from half to twice their annual salary, depending on seniority and how hard the role is to fill. The commonly cited breakdown looks like this:
Role level | Typical replacement cost (share of annual salary) |
Frontline employee | About 40% |
Technical or specialist role | About 80% |
Manager | 100% to 150% |
Senior leader | Up to about 200% |
SHRM frames it differently, often estimating six to nine months of salary per departure. Its average direct cost per hire sits at roughly $4,000 to $4,700 depending on the edition, but that covers only visible items such as job ads, agency fees and screening. For a $60,000 role, the range works out to $30,000 to $120,000. At national scale, Gallup puts the bill for voluntary turnover in the United States at about $1 trillion a year.
A quick illustration shows how fast it adds up. Take a 500-person company with an average salary of $50,000 and 17% attrition, which means about 85 exits a year. If each replacement costs 75% of salary, or $37,500, the employee attrition cost comes to roughly $3.2 million annually. This is an illustration, not survey data, but it explains why retention now gets discussed in finance meetings as well as HR reviews.
The hidden costs of turnover
The hidden costs of turnover are usually larger than the invoices. A vacant seat means lost output for weeks or months. A new hire needs time to reach full speed, and a manager spends hours interviewing instead of managing. Process knowledge, client relationships and unwritten workarounds leave with the person. Colleagues who watch a peer resign often start wondering whether they should be next. None of this appears in a standard replacement cost estimate, which is why most calculations lean conservative.
Why people actually leave
Pay matters, but it is rarely the whole picture. Gallup's retention research found that pay and benefits was the most common single reason for leaving, yet it was named only 16% of the time. When reasons are grouped into broader themes, engagement and culture (37%) and wellbeing and work-life balance (31%) together explain 68% of departures among US employees.
Regional surveys point the same way. In Australia, a 2026 study by people2people Recruitment found limited career opportunities was the top reason people quit, cited by 37% of jobseekers and 42% of employers. A UK survey by Ciphr, on the other hand, found feeling underpaid was the leading motivator for 36% of people planning a move.
The most useful finding may be this one: the Work Institute's 2025 retention report, built on more than 120,000 exit interviews, concluded that about 75% of voluntary departures were preventable.
What the evidence says about holding on to people
The research points to a few practical levers for bringing employee attrition cost down, none of them exotic.
- Manager quality. Managers shape the daily experience more than any policy does. Gallup has reported that roughly half of leavers say nobody talked with them about their future in their final three months.
- Visible career paths. Employees who can answer "where can I go from here?" are harder to lose. Development does not always mean promotion.
- A strong first year. With over a quarter of exits happening in year one, onboarding and early check-ins deserve serious attention.
- Honest pay benchmarking. Pay will not fix everything, but a clear gap against the market gives people a reason to look.
- Workload balance. Reliable employees are often asked to absorb every staffing gap, a common route to burnout.
Well-designed employee retention strategies tend to cost far less than the bill they prevent.
How to calculate your own number
The rate formula is simple: employees who left, divided by average headcount, multiplied by 100. Your own employee attrition cost takes more work. For each exit, add direct hiring expenses, productivity lost while the role was empty, ramp-up time and manager hours. Then split the result by team, tenure and manager, because a company-wide average can hide a department that quietly loses a third of its people.
Final thoughts
The data tells a consistent story. Employee attrition cost is large, mostly invisible, and largely avoidable. Turnover has cooled globally, yet engagement is weak and many workers are quietly looking. Organisations that measure their own numbers will be better placed when hiring loosens again.