

Your hiring metrics look strong. Time-to-hire is down. Cost-per-hire is controlled. Roles are closing faster.
Yet retention is slipping. Performance gaps are growing. Hiring managers are frustrated.
This is what happens when poor talent acquisition metrics create a false sense of success. When teams measure activity instead of outcome, real hiring problems stay hidden until they become expensive.
In this blog you will learn why talent acquisition metrics fail to expose critical hiring issues, the common TA metric blindspots that hide hiring problems, and practical steps to uncover and fix hidden gaps that misleading recruitment data and vanity hiring metrics often conceal.
TL;DR
- Poor talent acquisition metrics mask real hiring gaps by focusing on activity not outcome.
- Miscalculated KPIs hide quality, bias, and candidate experience failures.
- Relying on a single metric like time-to-hire creates blind spots in sourcing and selection.
- Integrate ATS data, recruiter inputs, and quality-of-hire measures into one view. Only then can you see true hiring performance.
- Use diagnostic dashboards, cohort analysis, and root cause reviews to fix hidden issues.
- Automate data collection, standardize definitions, and train teams to improve metric reliability.
- Action plan: audit metrics, align with business goals, pilot new KPIs, and track impact.
Why Talent Acquisition Metrics Fail to Expose Hiring Problems
Metrics fail for three consistent reasons: poor definitions, siloed data, and focus on activity rather than outcome. Each factor creates blind spots that let bad talent metrics persist. When teams treat recruitment metric flaws as a reporting problem instead of a business problem, misleading recruitment data becomes accepted wisdom.
Poor Definitions Create False Positives
Without clear definitions metrics mean different things to different people. Time-to-fill might include screen time in one report and exclude offer negotiation time in another. Recruiter productivity could count submitted candidates or interviews scheduled. When teams do not standardize definitions, reports can show steady improvement while real problems worsen. Improving TA measurement starts with one source of truth for each metric.
Siloed Data Produces Partial Stories
An ATS can show how many candidates entered the funnel. HRIS can show retention. Interview software tracks candidate feedback. If those systems are not connected you will not see how a strong sourcing engine produces hires who churn in six months. Siloed data makes talent acquisition metrics appear healthy while cost of poor hiring is rising. That separation also amplifies recruitment metric flaws and keeps teams from spotting selection bias.
Activity Metrics Mask Outcome Failures
Vanity metrics like number of requisitions closed or recruiter throughput reward speed not quality. A team can reduce time-to-hire by skipping reference checks or lowering hiring bar. Short term hiring velocity improves but quality of hire drops. That trade-off is invisible when metrics focus on activity rather than impact. Vanity hiring metrics create a false comfort that hides hiring problems until they become costly.
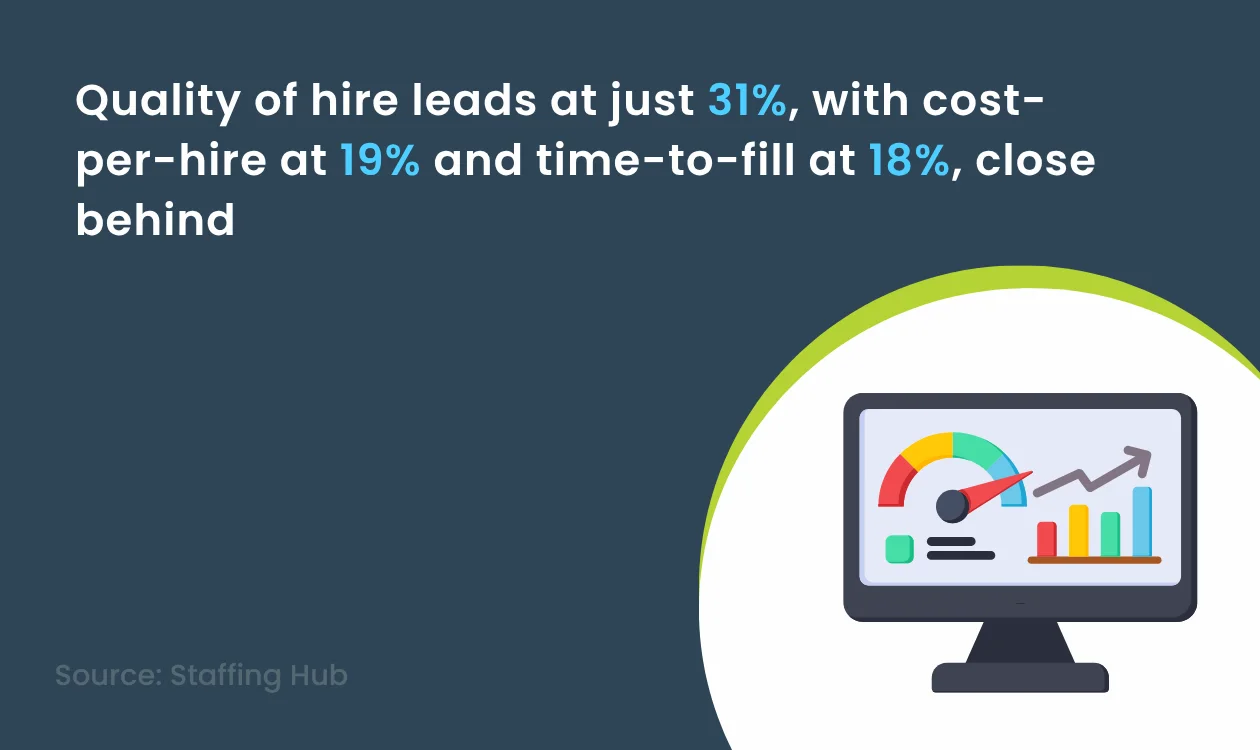
According to Staffing Hub survey, only about 31% of staffing agencies ranked quality of hire as their top recruiting metric, while cost-per-hire (19%) and time-to-fill (18%) followed closely. This shows that speed and cost still compete heavily with outcome-focused measures.
Common TA Metric Blindspots That Hide Problems
Below are the frequent traps I see in staffing and corporate recruiting teams. These TA metric blindspots often leave teams reacting to symptoms rather than fixing root causes.
1. Time-to-Hire Focus Alone
Time-to-hire is a popular metric. It is important but incomplete. An optimized time-to-hire can still deliver poor performers, cultural mismatch, or high turnover. If you measure only speed you will miss the cost of rehiring and ramp delays. This is a classic example of misleading recruitment data where a single number hides broader failures.
2. Quality-of-Hire Not Defined or Measured
Quality-of-hire should connect hiring decisions to performance and retention. Too often it is subjective or absent. Without it you cannot tell whether faster hires are better hires. Improving TA measurement requires tying quality to objective outcomes like performance ratings, promotion rates, and time-to-productivity.
3. Candidate Experience Reduced to NPS Only
Candidate NPS or satisfaction scores are useful. But a single score does not explain where experience breaks down. Low funnel conversion in phone screen to interview, high dropouts in offer stage, and delayed feedback loops each point to different fixes. A single candidate satisfaction metric hides these details and can be one more source of misleading recruitment data.
4. Cost-per-Hire Without Total Cost View
Cost-per-hire often counts advertising and agency fees but misses the hidden costs of ramp time, lost productivity, and manager time spent on poor hires. That narrow cost view masks the true economic impact of hiring mistakes and turns cost metrics into bad talent metrics when they do not reflect real business cost.
5. Diversity Metrics Stored Separately
Diversity metrics often live in compliance reports and are not integrated into sourcing and selection analytics. This separation makes it easy to meet a headline diversity target while selection biases remain unaddressed at stage gates. Treat diversity as part of the talent acquisition metrics fabric to spot bias early.
Real Examples That Reveal Hidden Problems
Case Example 1: A mid-sized tech firm celebrated a 20 percent reduction in average time-to-hire. But attrition at 90 days rose. Root cause analysis revealed a shortcut in screening: recruiters started skipping cultural fit discussions to speed hiring. The time metric improved but hiring quality and retention suffered. This shows how talent acquisition metrics can give a false positive signal.
Case Example 2: A staffing agency lowered cost-per-hire by relying more on job boards and less on targeted sourcing. Placements increased, but client satisfaction scores fell because placements did not match skill requirements. The cost metric had hidden the decline in placement quality. That is a clear case of bad talent metrics masking client impact.
Insight: Metrics that focus on a single dimension create a false narrative. Combine velocity, quality, and experience to see the full picture.
How to Audit Your Talent Acquisition Metrics
Run a diagnostic audit to find gaps and contradictions in your reporting. Use these steps to uncover hidden problems and start improving TA measurement across systems.
Step 1: Inventory All Metrics
List every metric you report monthly, weekly, and quarterly. Include the source system and the exact definition. Ask what business question each metric answers. This inventory helps reveal recruitment metric flaws and overlapping KPIs.
Step 2: Map Metrics to Outcomes
For each metric map the intended outcome it measures. Example: time-to-hire is meant to reduce vacancy costs and manager frustration. Quality-of-hire is meant to improve performance and retention. If a metric does not clearly map to a business outcome retire it or rework it. Mapping ensures your talent acquisition metrics measure what matters.
Step 3: Cross-System Reconciliation
Compare numbers across ATS, HRIS, payroll, interview platforms, and sourcing tools. Look for discrepancies that signal definition mismatch or data flow issues. Cross-system checks expose where misleading recruitment data originates.
Step 4: Cohort Analysis
Follow cohorts of hires and track performance, retention, and promotion over time. Cohort analysis often reveals selection biases and onboarding gaps that headline metrics miss. Use cohort views to show whether your talent acquisition metrics predict real outcomes.
Practical Revisions to Your Talent Acquisition Metrics Suite
Replace vanity metrics with a compact set that balances speed, quality, and experience. Here is a recommended core metric set and why each matters.
- Time-to-Fill with standardized start and end definitions to measure vacancy economics.
- Quality-of-Hire measured by performance ratings, promotion rate, and manager satisfaction at 6 and 12 months.
- Offer Acceptance Rate combined with reasons for declines to surface compensation and process issues.
- Candidate Dropout by Stage to identify funnel leaks in sourcing or selection.
- Hiring Source ROI that links source to retention and performance, not just placements.
- Diversity Conversion Rates by stage to detect selection bias and process barriers.
- Total Cost of Hire including hidden costs such as ramp time, training, and early turnover.
Tooling and Automation Tips
Use your ATS and HR analytics platform to automate metric calculations and combine data sources. Set up daily or weekly feeds so dashboards stay fresh. Configure alerts for unexpected deviations like sudden drops in offer acceptance or spikes in interview cancellations. Automation reduces manual errors that produce misleading recruitment data.
How AI and Automation Can Help Reveal Problems
AI can surface patterns that manual reporting misses. For example, natural language analysis of interview feedback can reveal consistent competency gaps. Automated anomaly detection flags sudden changes in funnel metrics that deserve attention. But AI is not a fix without good data governance. Garbage in, garbage out still applies.
Practical AI Use Cases
- Text analysis to identify common reasons for candidate declines and rejections.
- Predictive models to estimate quality-of-hire from pre-hire data and test biased signals.
- Automated dashboards that combine ATS, HRIS, and L&D metrics for cross-functional insight.
Implementation Roadmap to Fix Hidden Hiring Problems
Follow a simple roadmap to move from audit to action and stop letting bad talent metrics dictate hiring decisions.
| Phase 1 - Audit | Inventory metrics, identify contradictions, and prioritize gaps. |
| Phase 2 - Define | Standardize metric definitions and align with business outcomes. |
| Phase 3 - Integrate | Link ATS, HRIS, interview tools, and learning platforms for joined-up reporting. |
| Phase 4 - Pilot | Test new metrics and dashboards in one function or region and measure impact. |
| Phase 5 - Scale | Roll out validated metrics, train teams, and set governance for continuous review. |
Measuring Success After Talent Acquisition Metrics Fixes
Do not assume a metric change creates impact. Track leading and lagging indicators. Leading indicators include reduced candidate dropout and higher interview-to-offer conversion. Lagging indicators include higher first-year retention and faster time-to-productivity. Use both to prove your talent acquisition metrics are improving outcomes, not just appearances.
Set a review cadence. Check your metric set monthly and perform a deeper business review quarterly to ensure alignment with hiring and business goals. Regular reviews help spot TA metric blindspots early and prevent slipping back to vanity hiring metrics.
Conclusion
Poor talent acquisition metrics hide hiring problems by focusing teams on speed, activity, or surface-level cost measures. To uncover real issues, standardize definitions, integrate data, and balance speed metrics with quality and experience measures. Use cohort analysis, ATS integrations, and AI where appropriate to detect root causes early. With the right metric set and governance you will stop reacting to crises and start preventing costly hiring mistakes.
Next steps: Audit your metrics this quarter, pick three outcome-focused talent acquisition metrics to pilot, and create a dashboard that links hiring decisions to performance and retention. That simple change will reveal the hidden problems your current talent acquisition metrics fail to show. Stay ahead of the curve - explore more HR insights on NextInHR.